
|
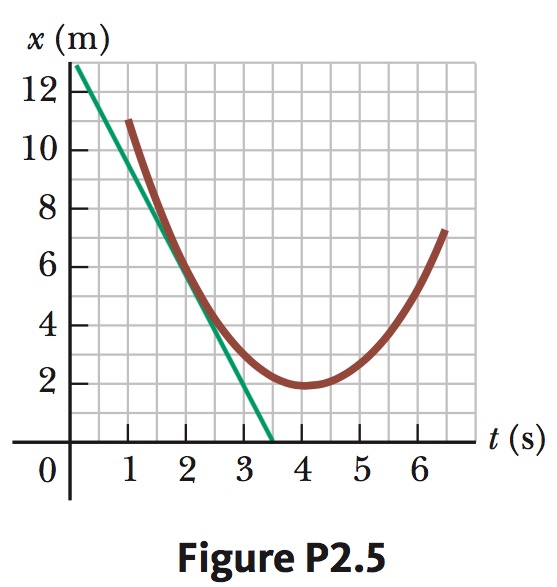
2. A position–time graph for a particle moving along the x axis is shown in Figure P2.5.
(a) Find the average velocity in the time interval `t = 1.50 s` to `t = 4.00 s`.
(b) Determine the instantaneous velocity at `t = 2.00 s` by measuring the slope of the tangent line shown in the graph.
(c) At what value of `t` is the velocity zero?
 `overline(v) = (∆x)/(∆t)`
(a) `-2.4m//s`
(b) `-3.7m//s`
(c) `4s`
(a)
From given graph red curve:
`x(1.50) = 8.0\ m`
`x(4.00) = 2.0\ m`
`overline(v) = (2.0m - 8.0m)/(4.00s - 1.5s) = color(red)(-2.4m//s)`
(b)
From given graph green line we get :
`x(0) = 13.0m`
`x(3.5) = 0 m`
slop of green line, which is the instantaneous velocity:
`v = (0m-13.0m)/(3.5s-0s) = color(red)(-3.7 m//s)`
(c)
The velocity equals 0 when the slope of the tangent equals 0.
And the slope of the tangent equals 0 when it's parallel to the time axis in given graph, where `t = 4s`.
|