
|
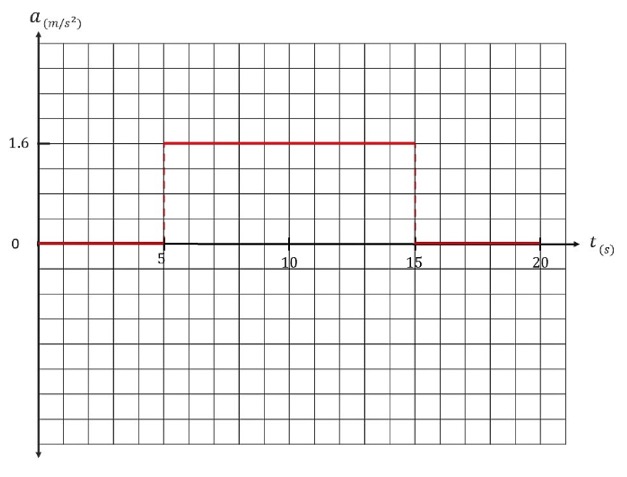
2. A velocity–time graph for an object moving along the x axis is shown in Figure P2.13.
(a) Plot a graph of the acceleration versus time. Determine the average acceleration of the object
(b) in the time interval `t=5.00s` to `t=15.0s` and
(c) in the time interval `t = 0` to `t = 20.0 s`.
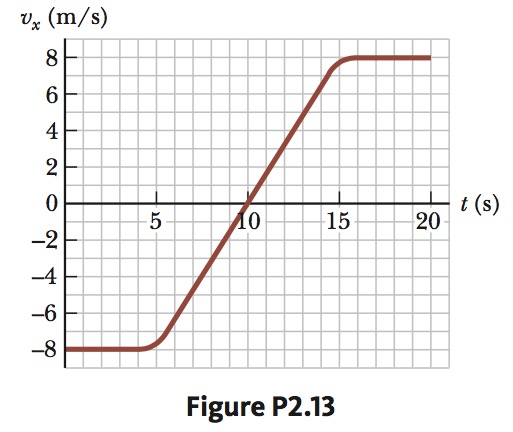 `a = (∆v)/(∆t)`
(a) see graph
(b) `1.6 m//s^2`
(c) `0.8 m//s^2`
 |