|
Graphy y = sinx
when we graphing a function, we can always start by picking points.
Let's begin with an example of the simplest Trigonometric graph.
`y = sin(x)`
| `X` |
`0` |
`π/2` |
`π` |
`(3π)/2` |
`2π` |
| `Y` |
`0` |
`1` |
`0` |
`-1` |
`0` |
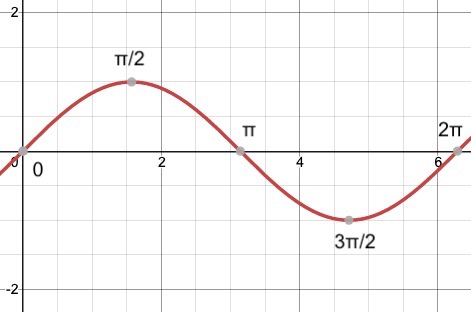
You can see that the sine curve starts at 0, increases to 1, decrease to 0, further decrease to -1, and increases back to 0.
Now, what if we pick more points to the left or right of the graph?
| `X` |
`0` |
`-π/2` |
`-` |
`-(3π)/2` |
`-2π` |
| `Y` |
`0` |
`-1` |
`0` |
`1` |
`0` |
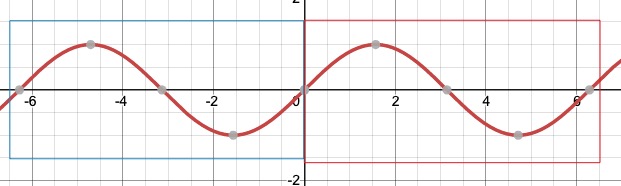
Well, we find the graph just "repeats" itself. We call this function is periodic
|