
Position-time graph for constant velocity
If an object is moving under a constant velocity (`v = 5 m//s`), the Position–time graph will be:
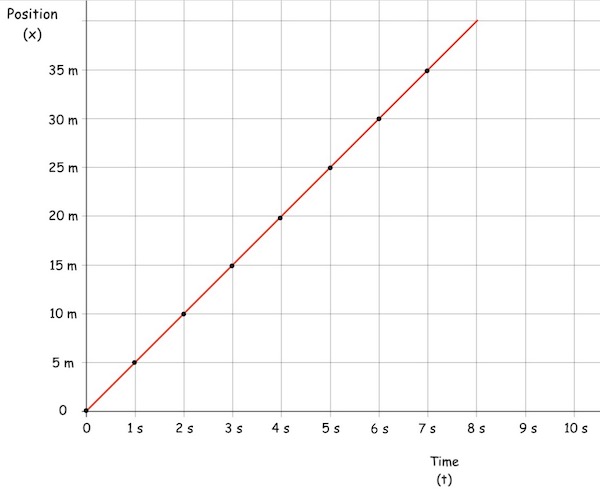 Position–time graph for an object under constant velocity. The value of the constant velocity is the slope of the line.
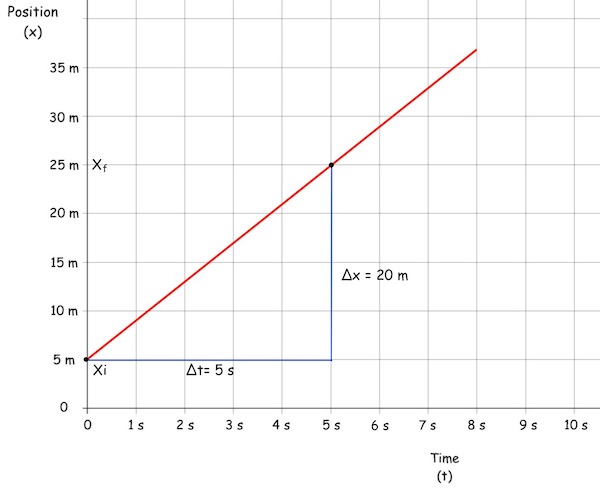
Position–time graph for an object under constant velocity. The value of the constant velocity is the slope of the line.
`v = (∆x)/(∆t)` where `∆x = x_f-x_i`
`=>v = (x_f-x_i)/(∆t)`
`=>`
`x_f = x_i + v∆t`