
Graphy y = cosx
Now , Let's another an example of Trigonometric graph.
`y = cos(x)`
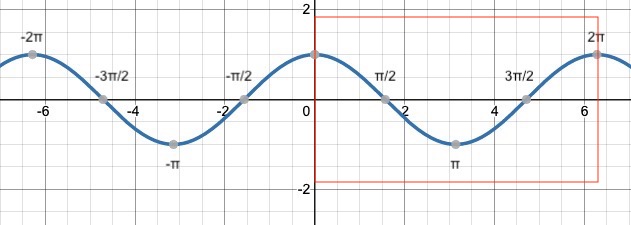 You can see that the cos curve starts at 1, decrease to 0, further decrease to -1. than it increase back to 1
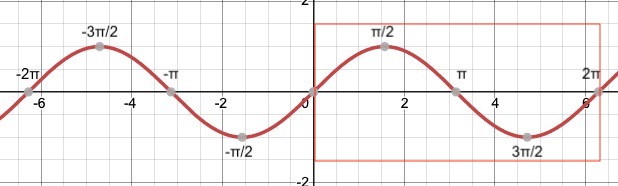
Compare with sin graph, it is periodic too. it looks just shift a little bit.
You can see that the cos curve starts at 1, decrease to 0, further decrease to -1. than it increase back to 1
Compare with sin graph, it is periodic too. it looks just shift a little bit.
| `X` | `-2π` | `-(3π)/2` | `-π` | `-π/2` | `0` | `π/2` | `π` | `(3π)/2` | `2π` |
| `Y` | `1` | `0` | `-1` | `0` | `1` | `0` | `-1` | `0` | `1` |
You can see that the cos curve starts at 1, decrease to 0, further decrease to -1. than it increase back to 1
Compare with sin graph, it is periodic too. it looks just shift a little bit.